In this article we will cover worked examples of how to calculate what the earned value of your project is, but before jumping into examples the following outlines some key terms and formulas for anyone wanting to use Earned Value within their project reporting tools:
| Term | Description |
| EV = Earned Value |
The Monetary Value of the Work that was Actually Completed by the specified Date.  |
| PV = Planned Value |
The monetary value of the work that was estimated or planned to be completed by the specified date. PV = BAC x Planned % Complete |
| AC = Actual Cost | The Actual cost of work performed by the specified date. In other words, it is the amount you have actually spent on the project. It can be described as the actual cost incurred for the work accomplished. |
| SV = Schedule Variance |
A measure of the difference between the work that was actually done against the amount of work that was planned to be done. SV = EV – PV Negative Variance means Project is Behind Schedule. |
| CV = Cost Variance |
The measure of the difference between the amount that was budgeted for the work meant to be done and the amount that was actually spent for the work performed. Thus this shows if the project is on budget or not. CV = EV – AC Negative Variance means Project is Over Budget. |
| SPI – Schedule Performance Index |
The ratio between the budget that is approved for the work that is performed to the budget that is approved for the work that was planned in the first place. This is a relative measure of the project’s time efficiency. SPI = EV / PV SPI < 1 means Project is Behind Schedule. |
| CPI = Cost Performance Index |
The ratio between the approved budgets for the work that is performed to the budget that was actually spent for the stipulated work. It is a relative measure of the cost efficiency of the project and can be used to estimate the cost of the remainder of the task. CPI = EV / AC CPI < 1 means Project is Over Budget. |
| ETC = Estimate to Complete |
Is the estimated cost of the remaining work on the specified date ETC = (BAC – EV) / CPI |
| EAC = Estimate at Completion |
Is the revised estimated budget for the project from the specified date. EAC = AC + ETC |
| VAC = Variance at Completion |
Is the difference between the total planned cost and the actual cost at completion. VAC = BAC – EAC Negative Variance means Actual Cost of Project is likely to be more than the Planned Cost |
| BAC = Budget At Completion |
The Estimated or Planned Cost required to complete the Project. But sometimes it could also mean Estimated or Planned Cost required to complete a Milestone(s). |
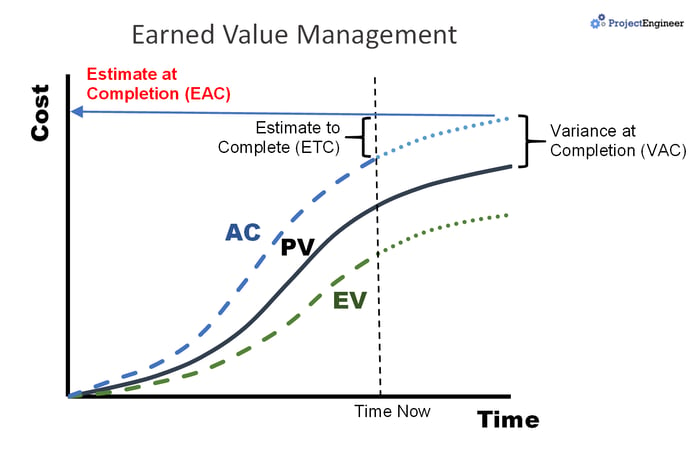
When completing the EVM calculations using formulas above, the normal output is an EVM graph that allows the reader to clearly see where the project current is. Source Supplied by www.projectengineer.net
Applying Earned Value Management Example:
Your project has a budget of $200,000
You have contractors that are required to undertake 1,000 sample tests and Assays within 100 days of submission
On the 30th day they reported that 350 samples and assays were completed and issued you an invoice for $65,000.
Lets work through the EVM formulas to define how this project is progressing.
On face value theoretically the project should be 35% complete based on the number of assays they have completed. The budget however indicates they have only completed 32.5% why the disconnect?
| Measurement | Calculation | Result |
| BAC (Budget At Completion) | Nil | $200,000 |
| PV (Planned Value) | BAC x Planned % Complete | $200,000 x 30% = $60,000 |
| AC (Actual Cost) | Sum of all work completed | $65,000 |
| EV (Earned Value) | Actual % Complete x BAC | 35% x $200,000 = $70,000 |
| SPI (Schedule Performance Index) | EV / PV (if <1 ahead of schedule) | $70,000 / $60,000 = 1.16 |
| SV (Schedule Variance) | EV - PV (if $ are + ahead of schedule) | $70,000 - $60,000 = $10,000 |
| CPI (Cost Performance Index) | EV / AC (if <1 under Budget) | $70,000 / $65,000 = 1.076 |
| CV (Cost Variance) | EV – AC (if <0 within budget) | $70,000 - $65,000 = $5,000 |
| ETC (Est To Complete) | (BAC – EV) / CPI | ($200,000 - $70,000) / 1.076 = $120,817 |
| EAC (Est At Completion) | AC + ETC | $65,000 + $120,817 = $185,817 |
| VAC (Variance at Completion) | BAC – EAC (if <0 under budget) | $200,000 - $185,817 = $14,183 |
To answer the question in this example. The reason why the project shows a difference between the schedule at 35% and actual cost at 32.5% is the time and cost to complete an assay is lower than what was planned. Providing the same rate of spending occurs until the projects end the project budget is projected to be under by $56.
Capital Intensive EVM
Now to complicate this further particularly where there is heavy capital and procurement up front this has the potential to distort accurate project reporting.
A key point within these types of projects is integrating within the contractors obligations a requirement for them to supply or have a mechanism to extract earned value data from the contractor or supplier, without this it will not be possible to accurately forecast and report on EVM.
Unfortunately, many organisations and departments within organisations have competing or misaligned metrics. Often procurement will have a single metric, which is price, possibly scope, but mostly price. Focus is not on other areas like schedule, risk or milestones that are going to help the project determine its progress.
Similarly, within the finance areas reporting focuses on the chart of accounts which is a lagging indicator as its always in arrears.
One way to mitigate against these gaps is to ensure the project has a detailed work breakdown structure and a package breakdown structure, coupled with a reconciliation table that aligns the work breakdown structure and the package breakdown structure with the account codes which will help define costs against specific work and schedule.
Within Procurement, where 60% of a project is major capital, the project may source the equipment early, therefore money may go out of the BAC before any work has even started. See diagram below:
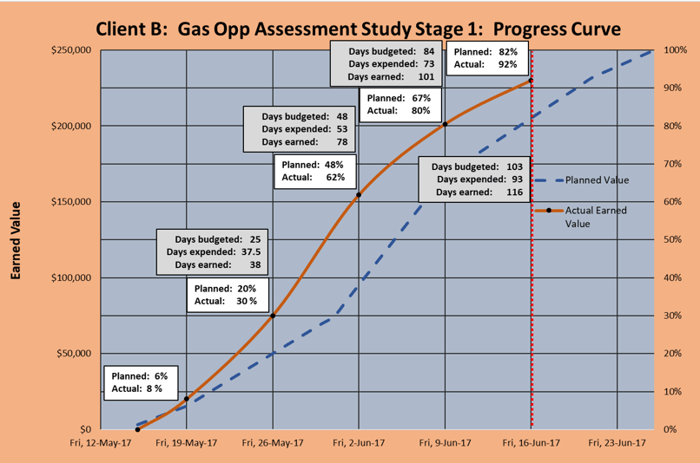
Plotting cost on a graph/S curve, there is a huge amount of expenditure above the blue dotted line, this may be misinterpreted as the project is way ahead of where it should be.
The truth here states that the project has spent 60% of the BAC, but it has not achieved 60% of PV, the PV or effort might be at 20%.
This is where EVM would identify the real position of the project relative to the plan. It normalises things like cost and time properly.
For more information on other Project Management Tools, jump to our Project Management page
Reference:
https://en.wikipedia.org/wiki/Earned_value_management
We welcome your feedback on the information in this post, and would be happy to discuss any requirements that you may have: